
Docker安装Grafana
docker run -d --name=grafana -p 3000:3000 grafana/grafana |
默认用户名密码admin/admin
Docker安装Prometheus
docker pull prom/prometheus |
docker run -d \ |
项目集成Prometheus
<dependency> |
然后,在启动类 Application.java 添加如下注解:
|
最后,配置默认的登录账号和密码,在 application.yml 中:
security: |
提示:不建议配置
management.security.enabled: false
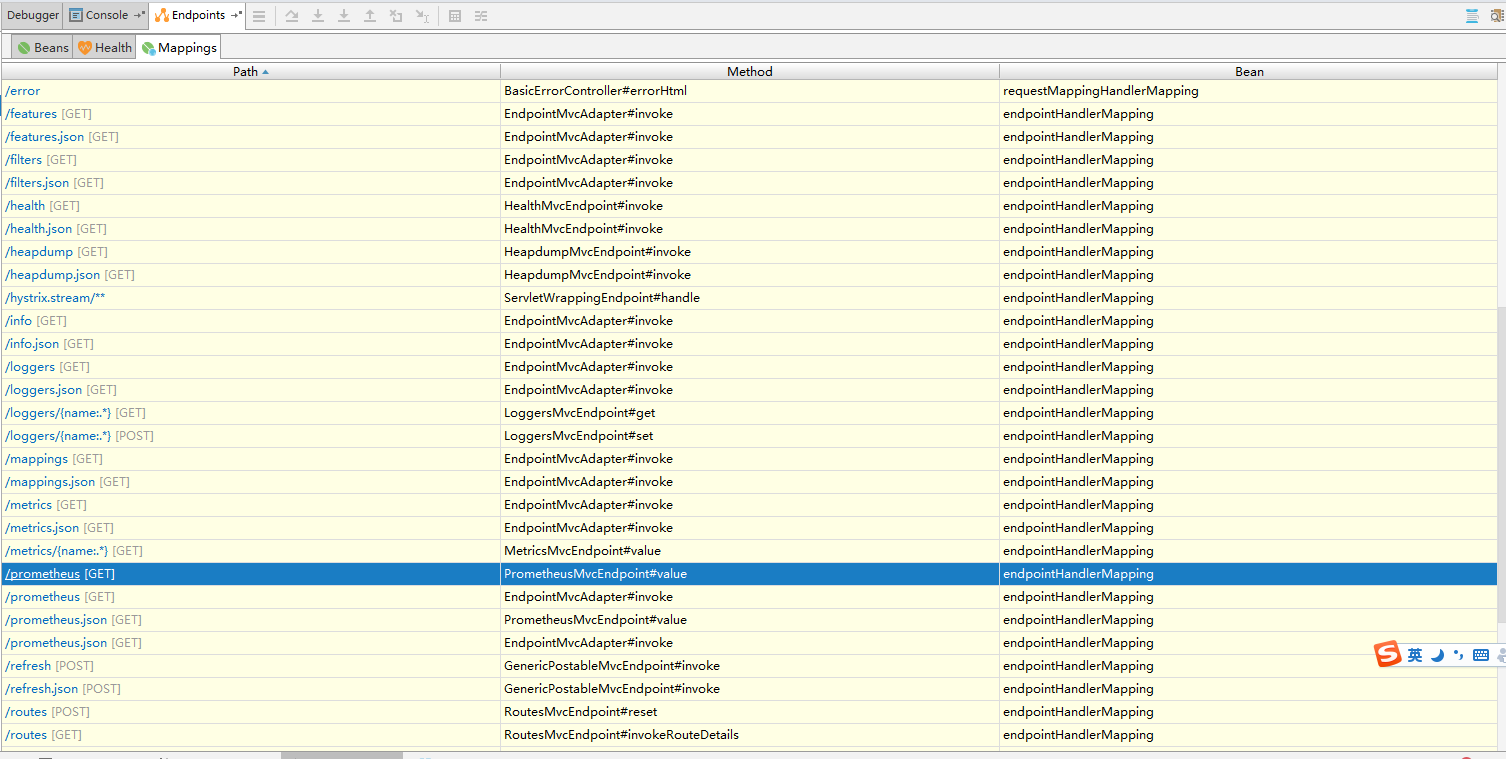
启动应用程序后,会看到如下一系列的 Mappings
然后,编写配置文件 prometheus.yml
scrape_configs: |
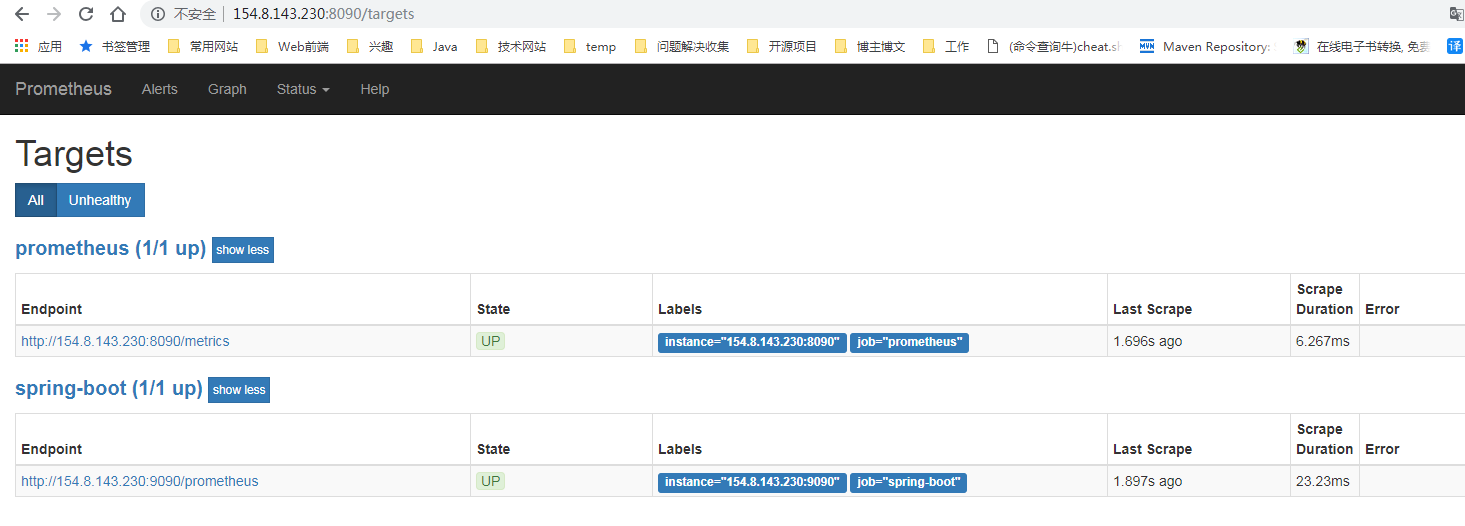
最后,访问Prometheus地址端口 , 检查 Spring Boot 采集状态是否正常。
Grafana 可视化监控数据配置
Grafana 登录账号 admin 密码 admin
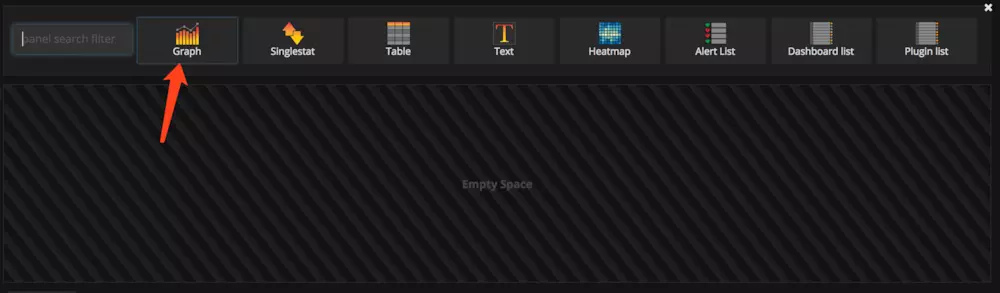
1、配置单个指标的可视化监控面板:
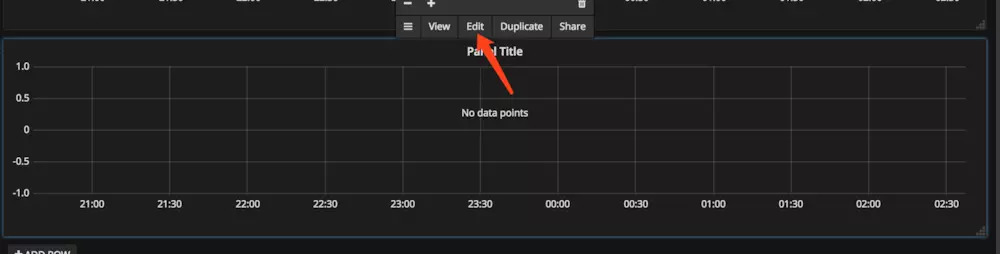
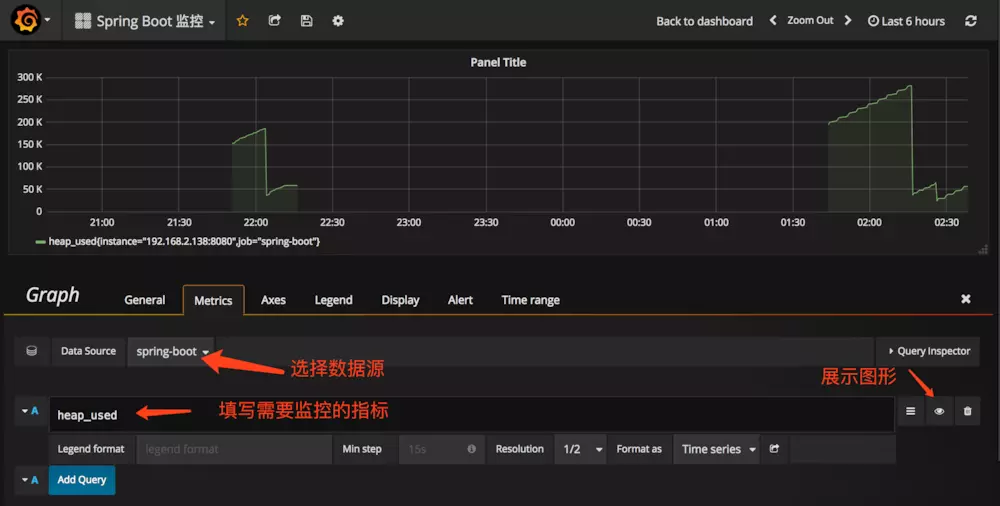
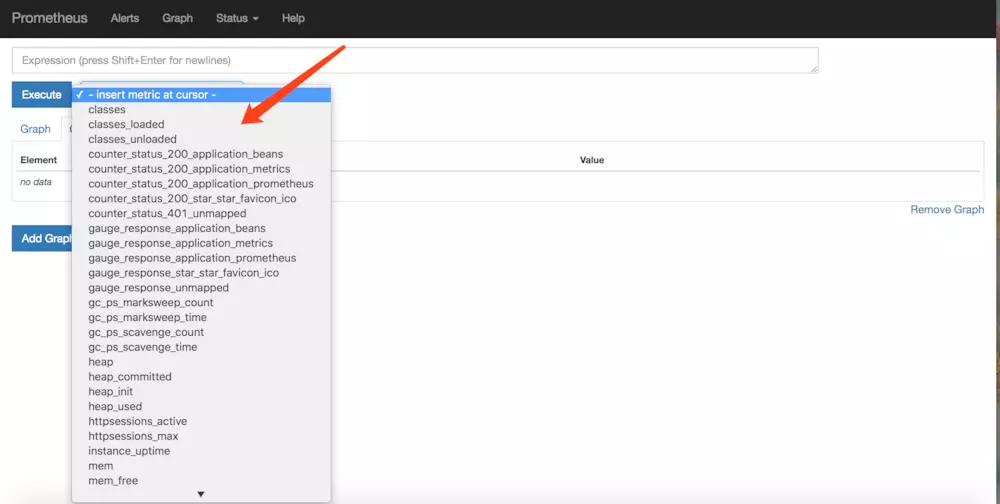
提示,此处不能任意填写,只能填已有的指标点,具体的可以在 Prometheus 的首页看到,即 http://localhost:9090/graph
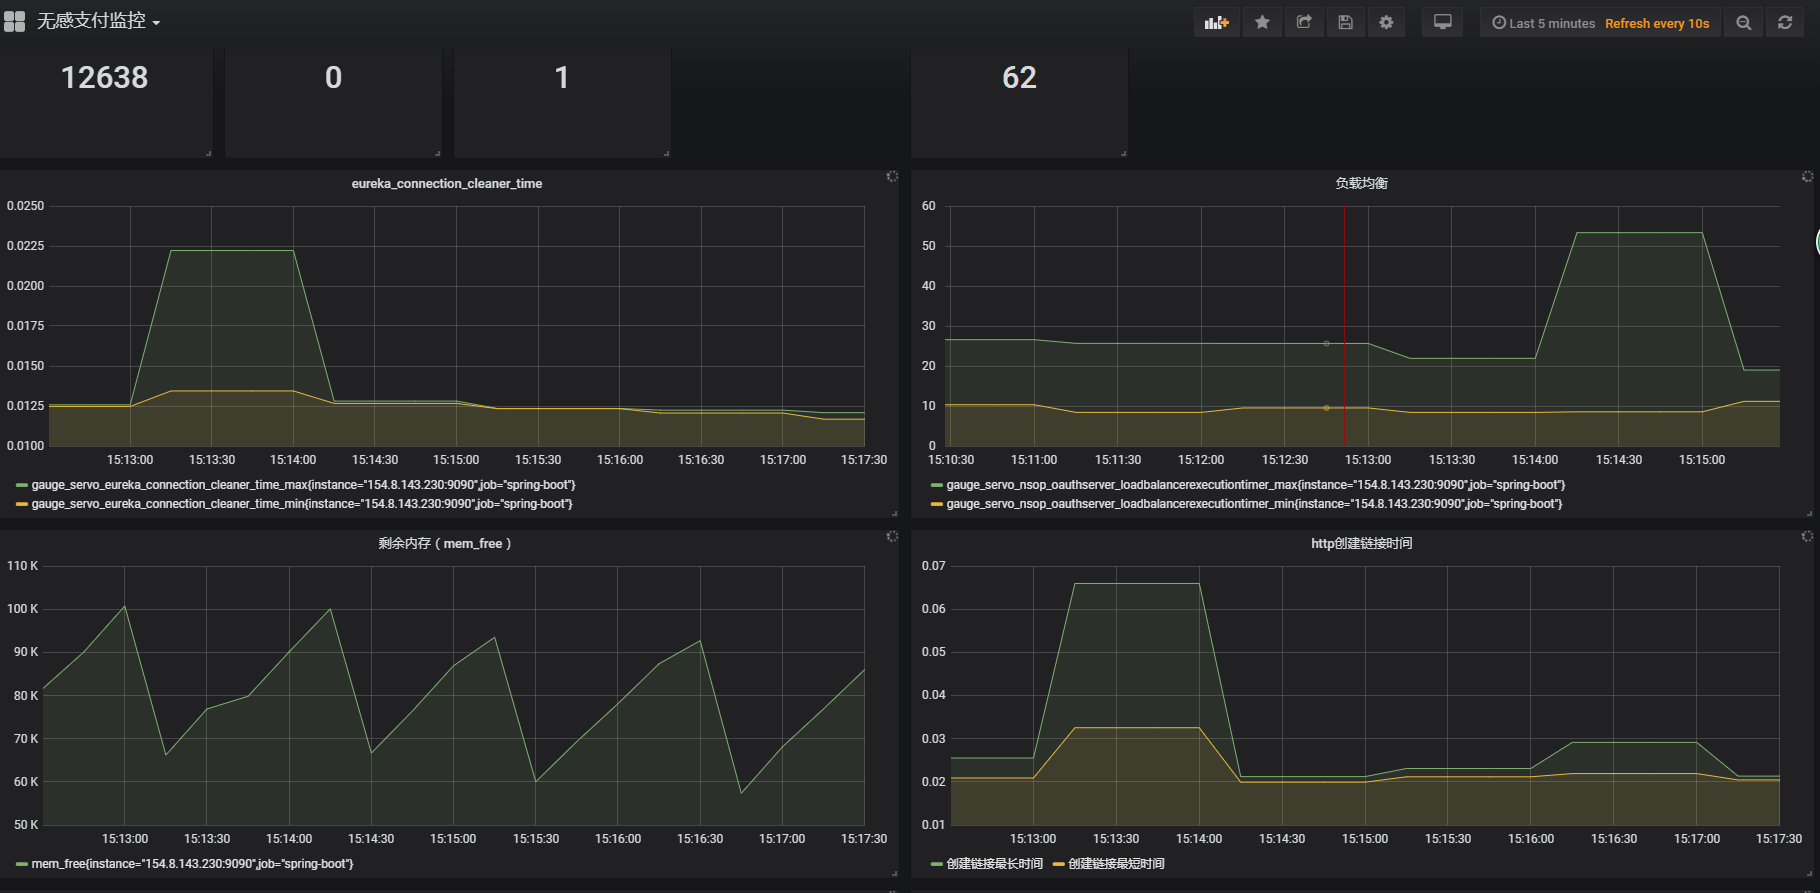
多配置几个指标之后,即可有如下效果:
参考网站
https://www.jianshu.com/p/7ecb57a3f326
发送数据到Prometheus
生成数据供Prometheus使用有两种方法
配置
micrometer-registry-prometheus<dependency>
<groupId>org.springframework.boot</groupId>
<artifactId>spring-boot-starter-actuator</artifactId>
</dependency>
<dependency>
<groupId>io.micrometer</groupId>
<artifactId>micrometer-registry-prometheus</artifactId>
<version>${micrometer.version}</version>
</dependency>
<dependency>
<groupId>io.micrometer</groupId>
<artifactId>micrometer-spring-legacy</artifactId>
<version>${micrometer.version}</version>
</dependency>配置
simpleclient_spring_boot这个库是prometheus官方提供的
<dependency>
    <groupId>org.springframework.boot</groupId>
    <artifactId>spring-boot-starter-actuator</artifactId>
</dependency>

<dependency>
    <groupId>io.prometheus</groupId>
    <artifactId>simpleclient_spring_boot</artifactId>
    <version>0.6.0</version>
</dependency>
两个库都可以提供暴露数据给prometheus https://github.com/prometheus/client_java
参考
1、https://blog.csdn.net/liufei198613/article/details/82460883 介绍micrometer-registry-prometheus
2、https://blog.csdn.net/zl1zl2zl3/article/details/75045005 介绍simpleclient_spring_boot